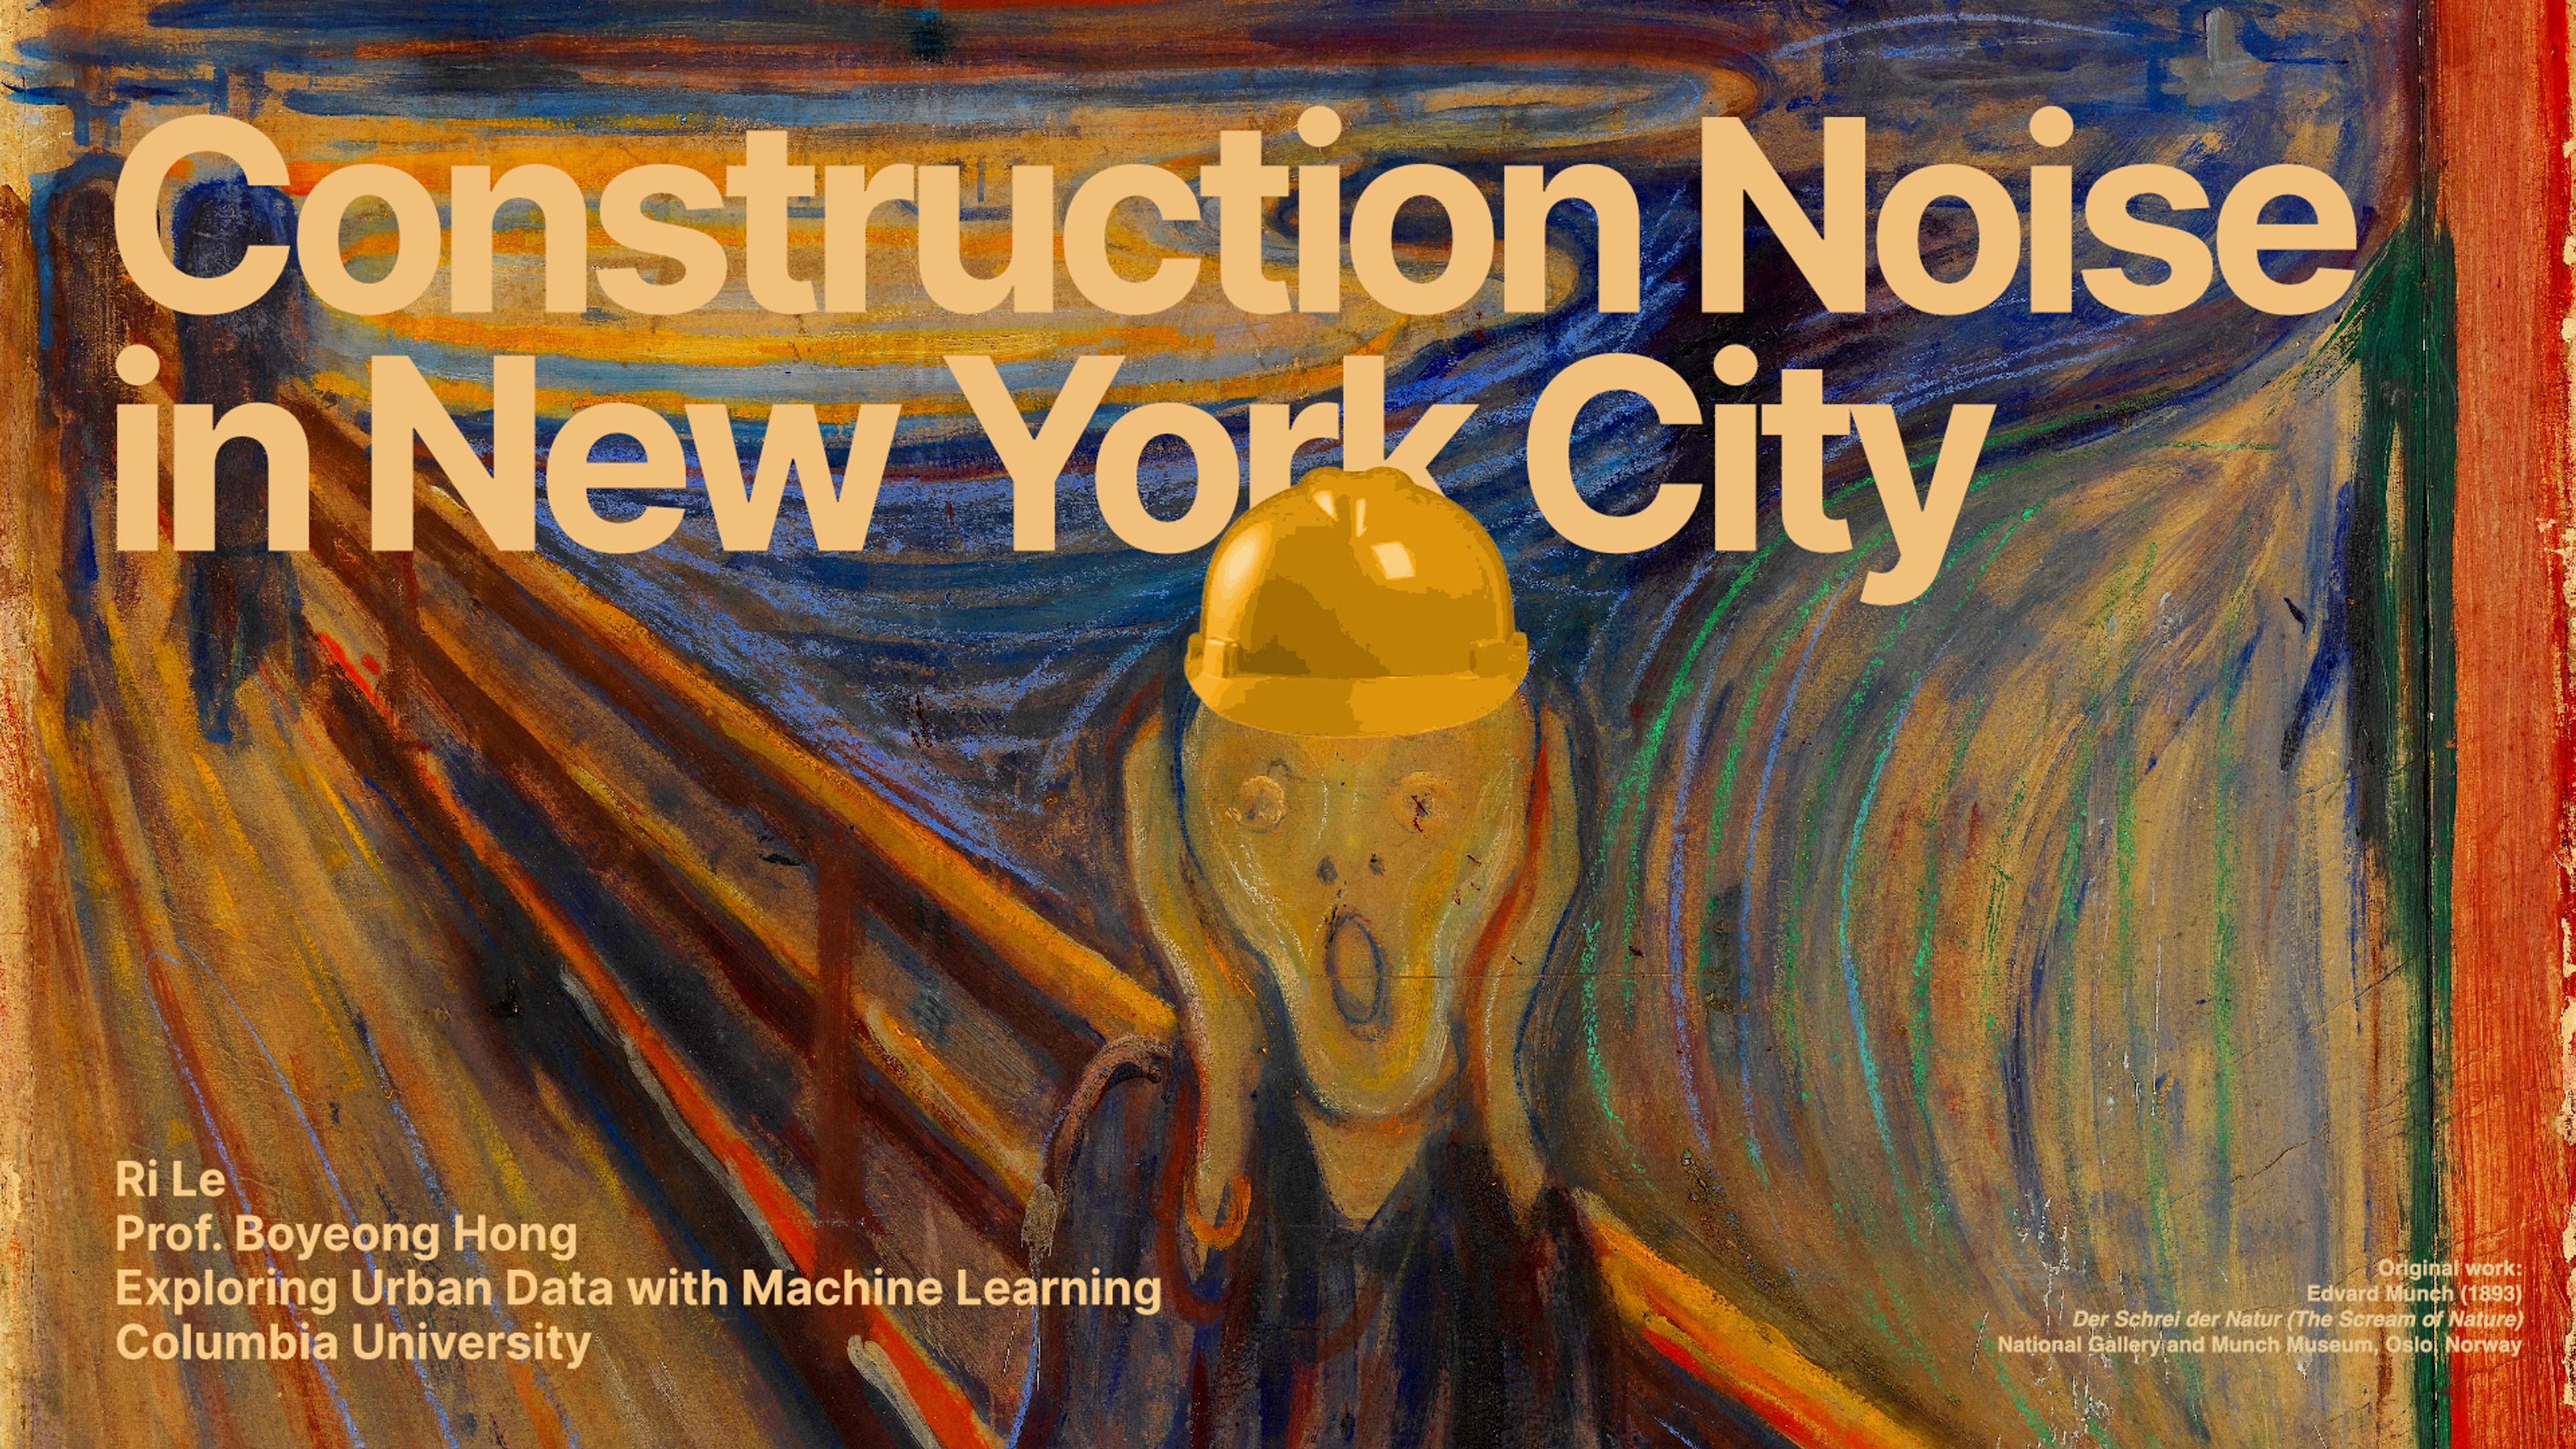
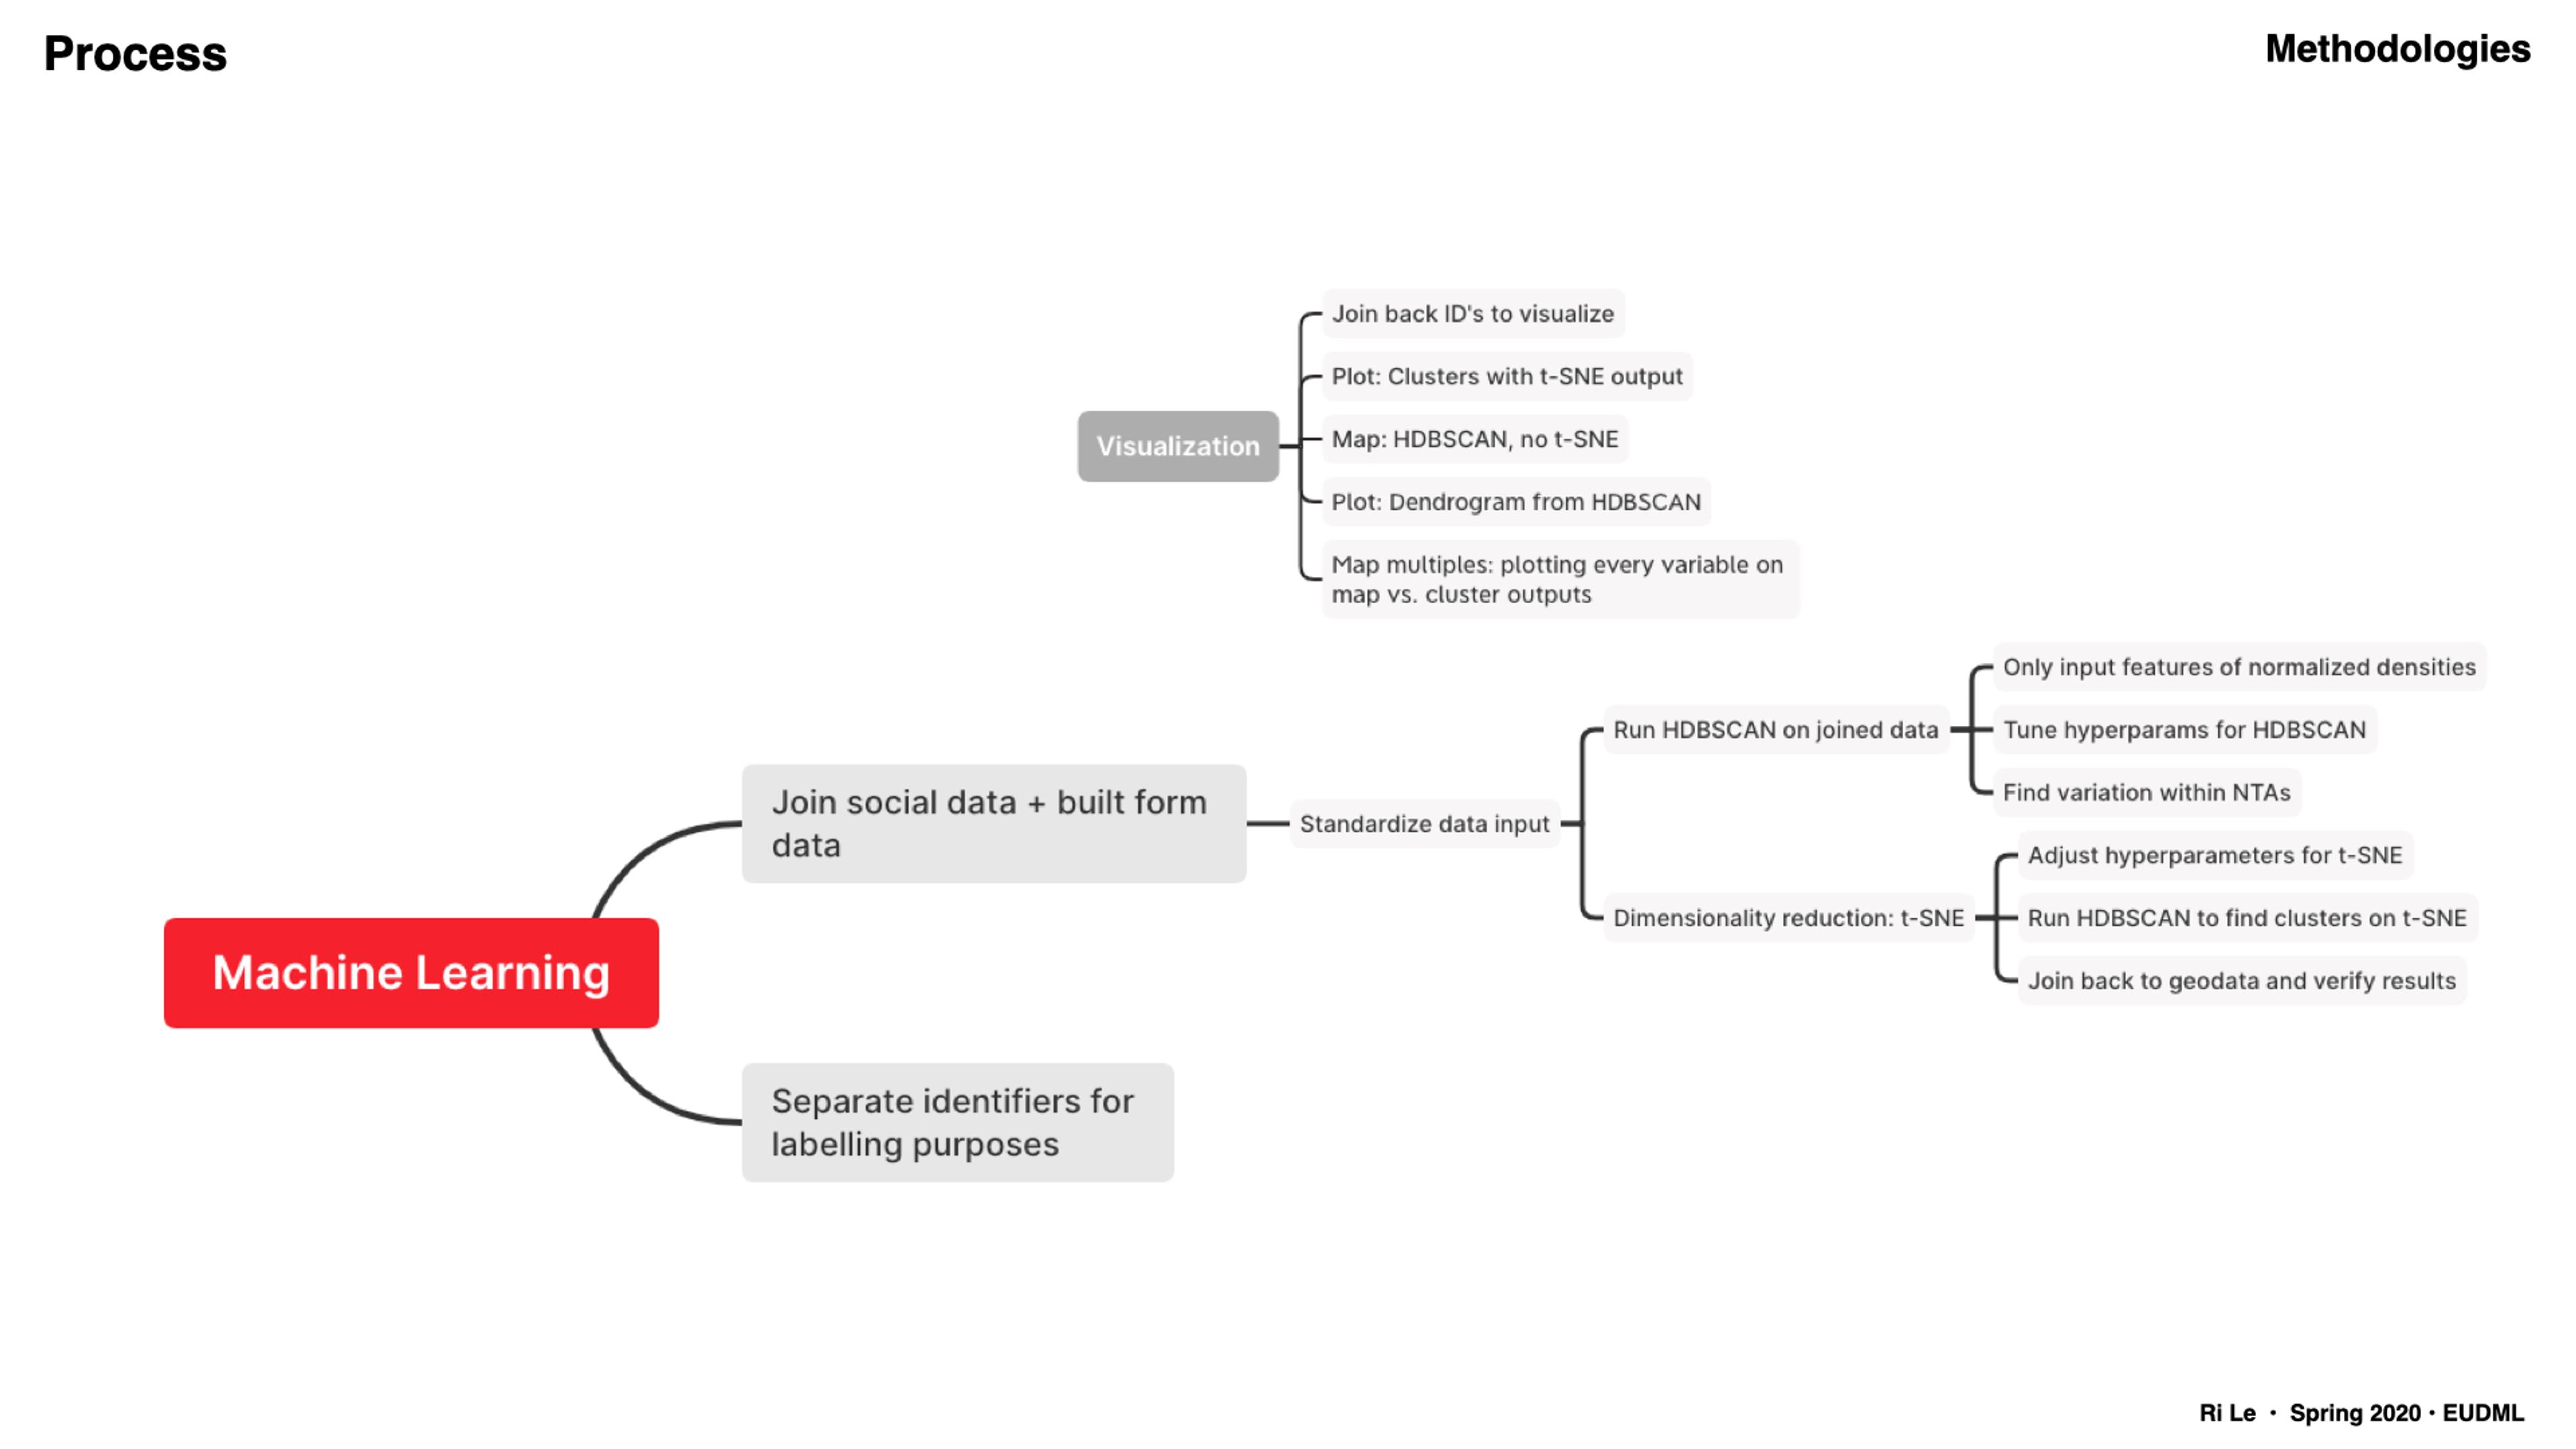
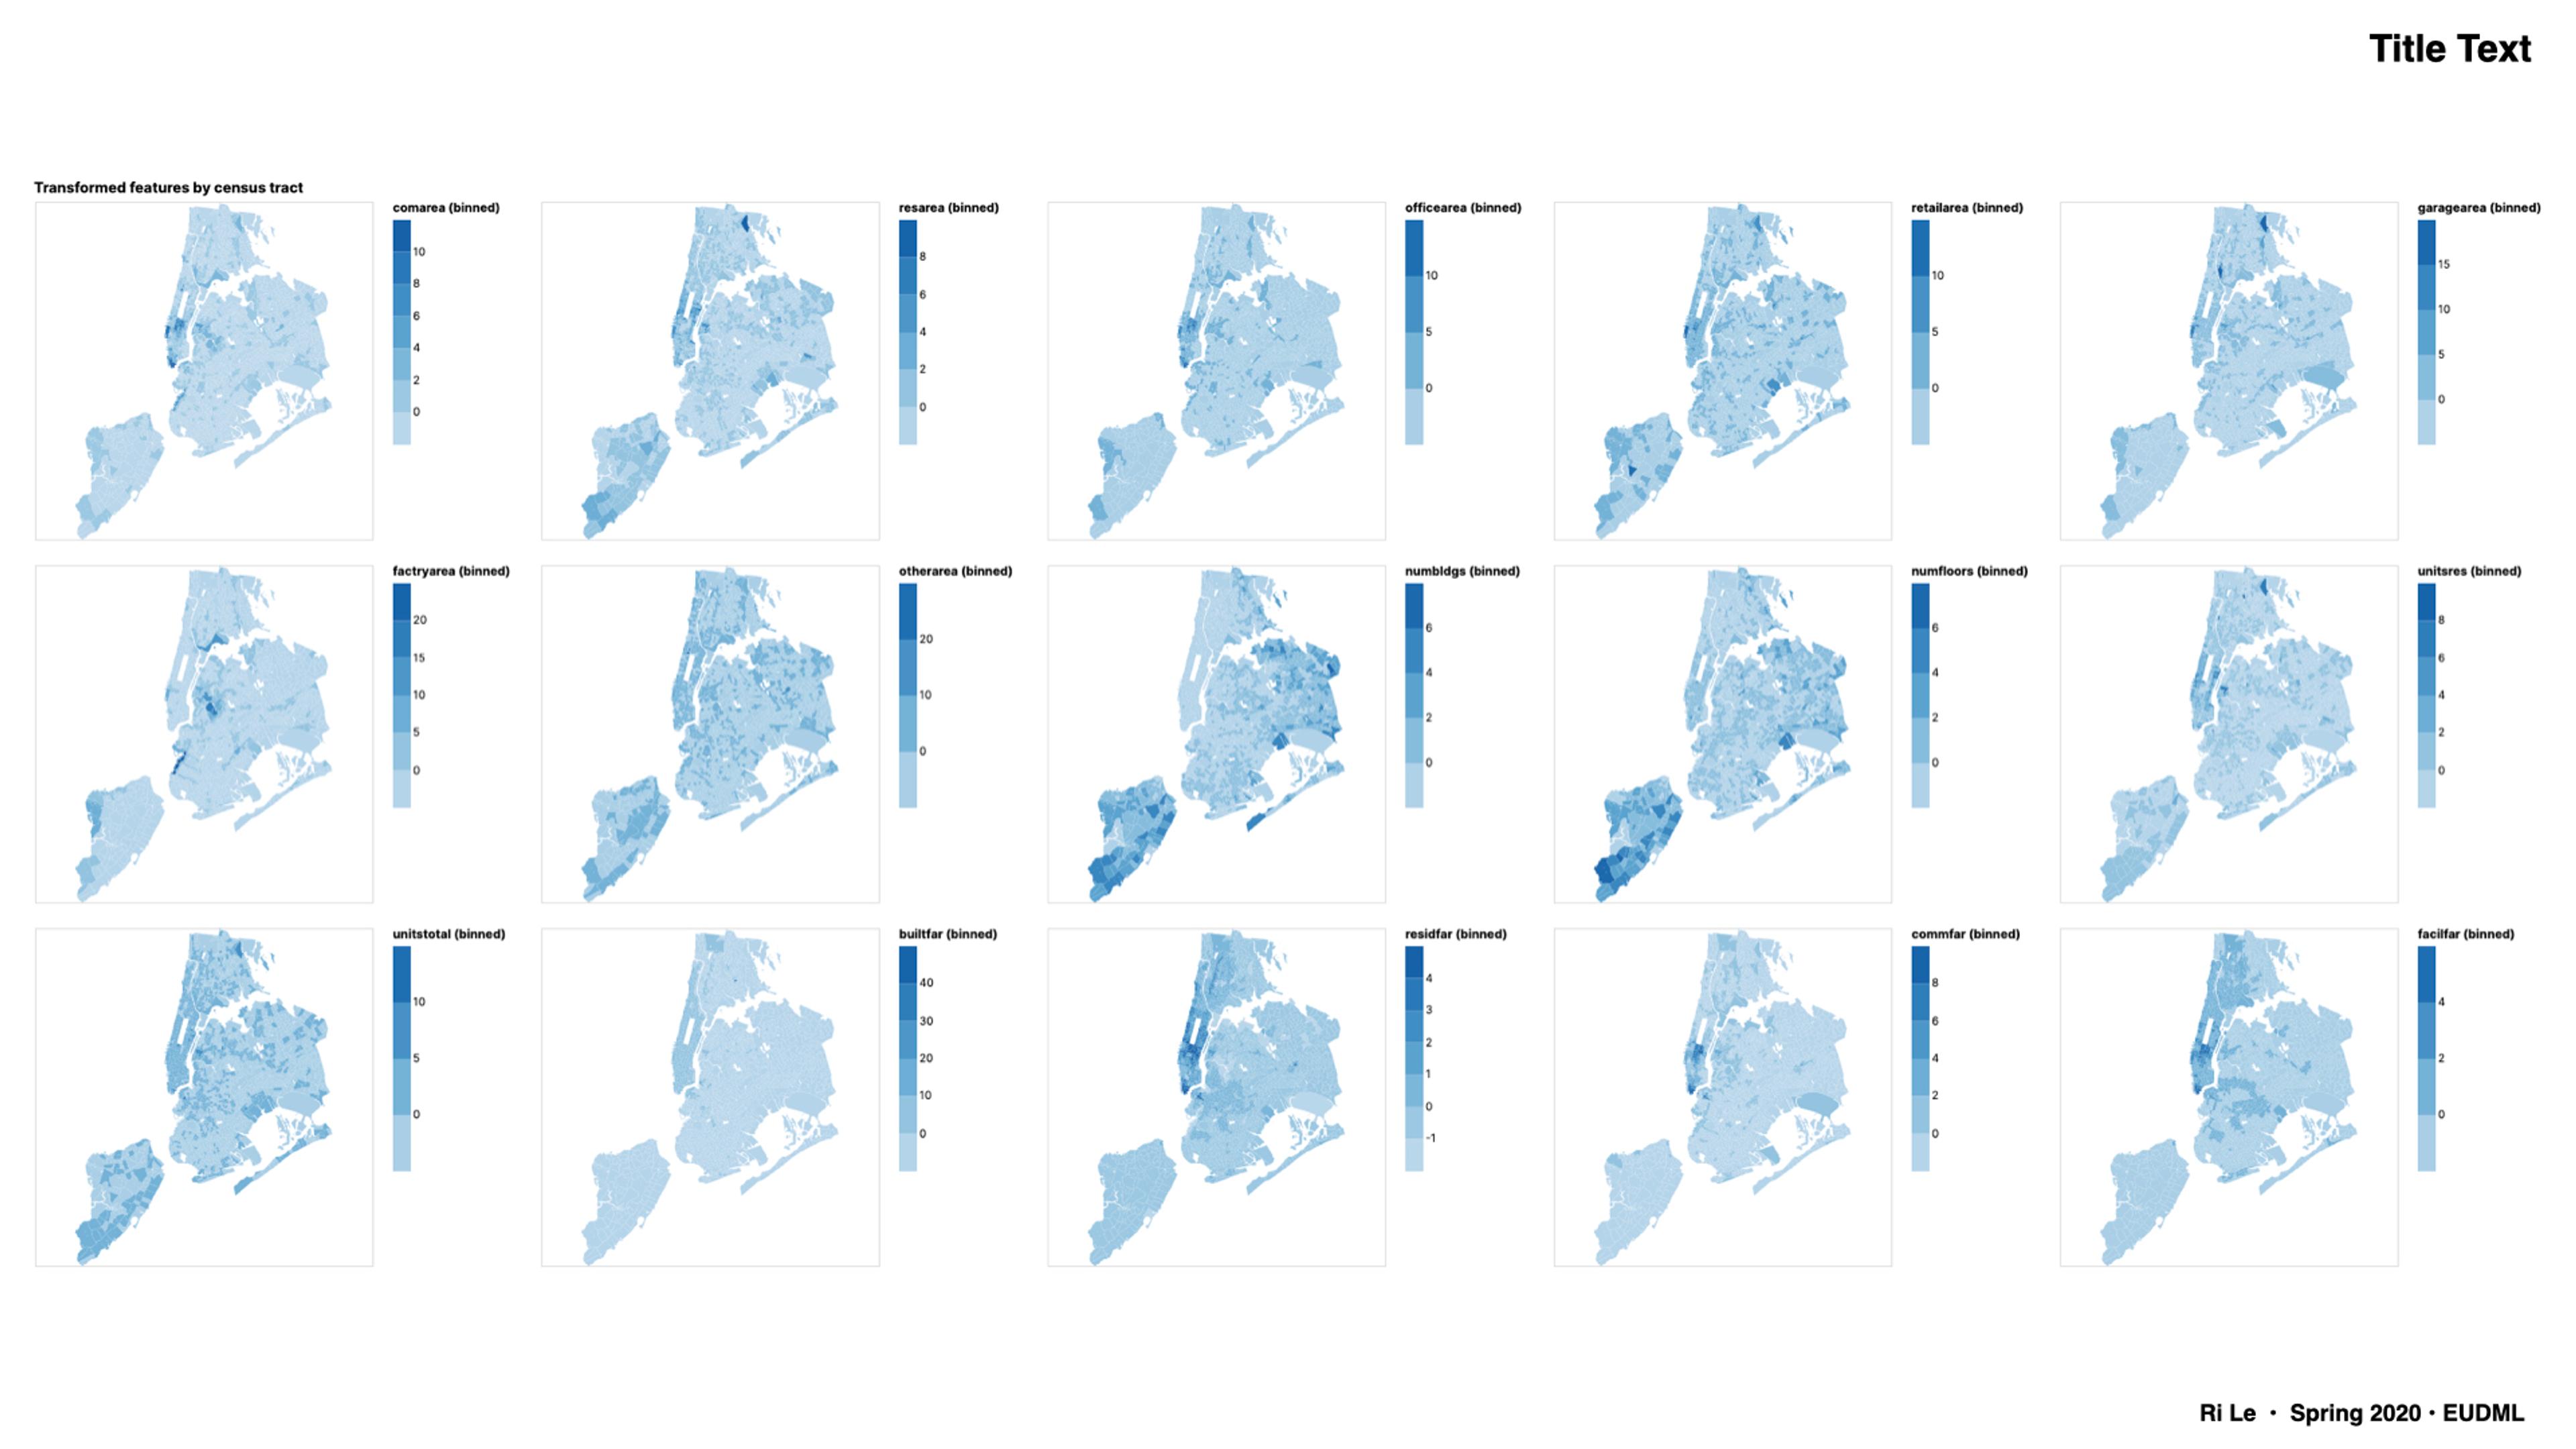
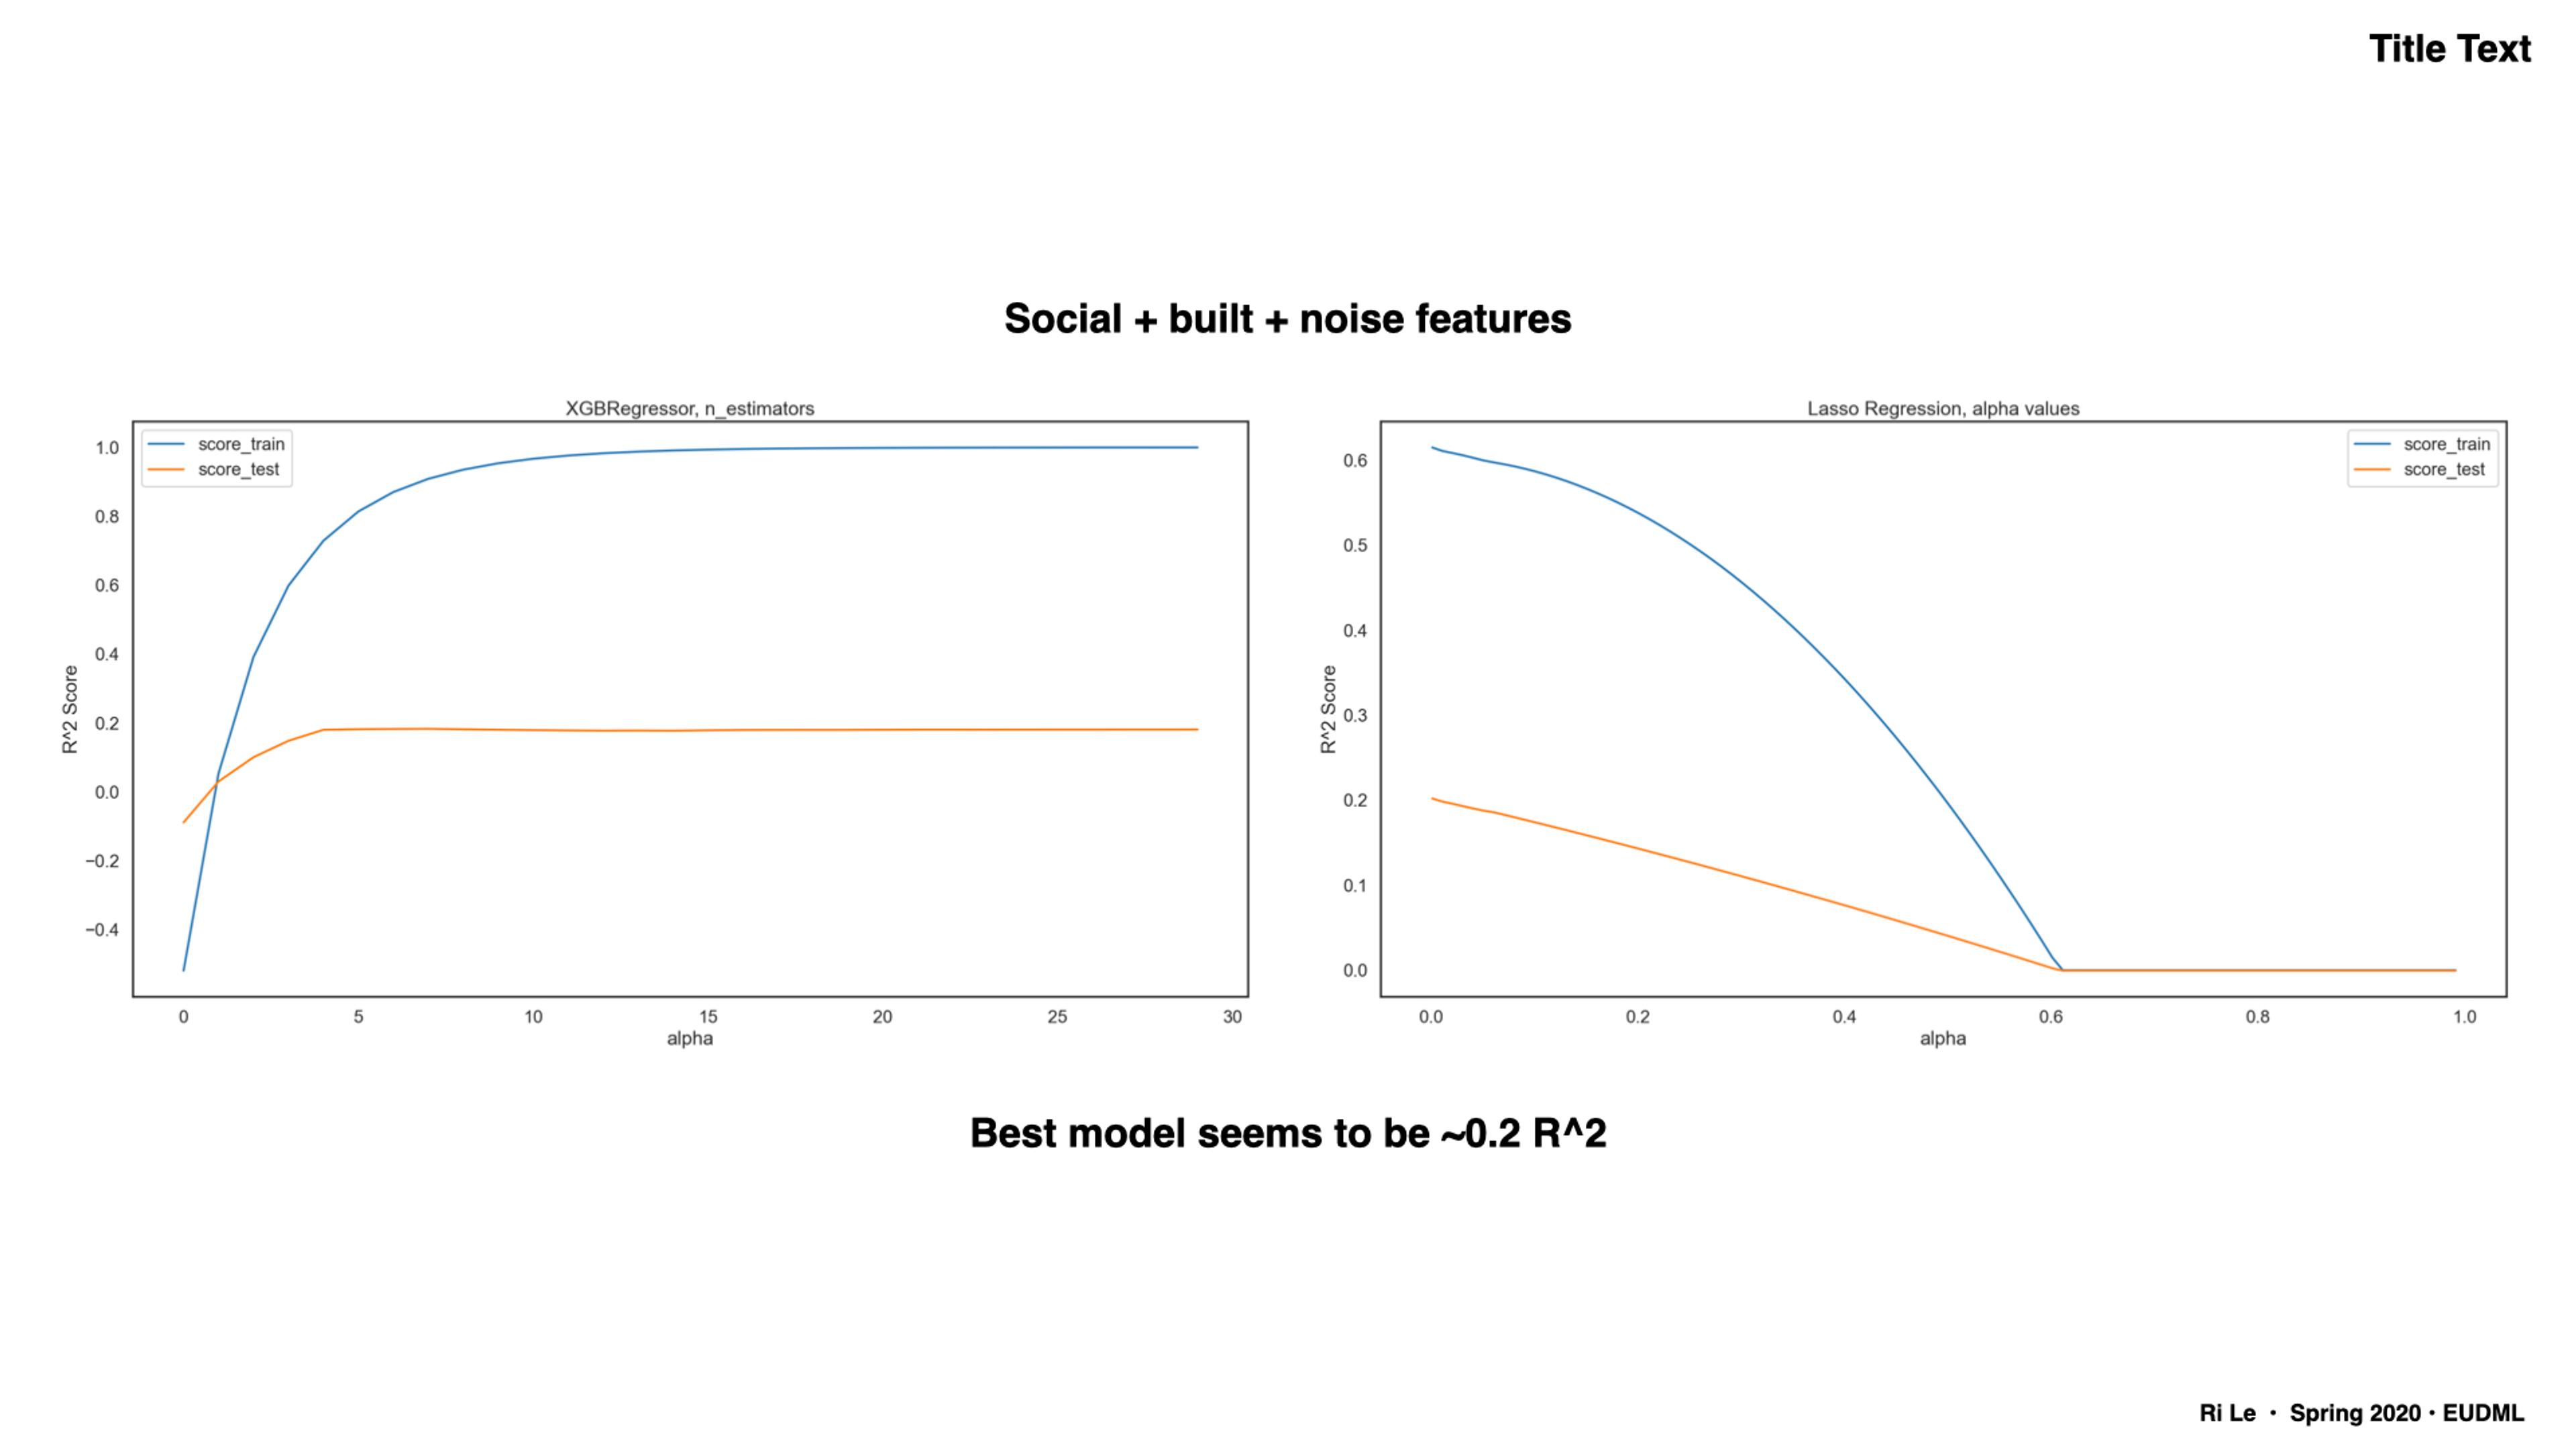
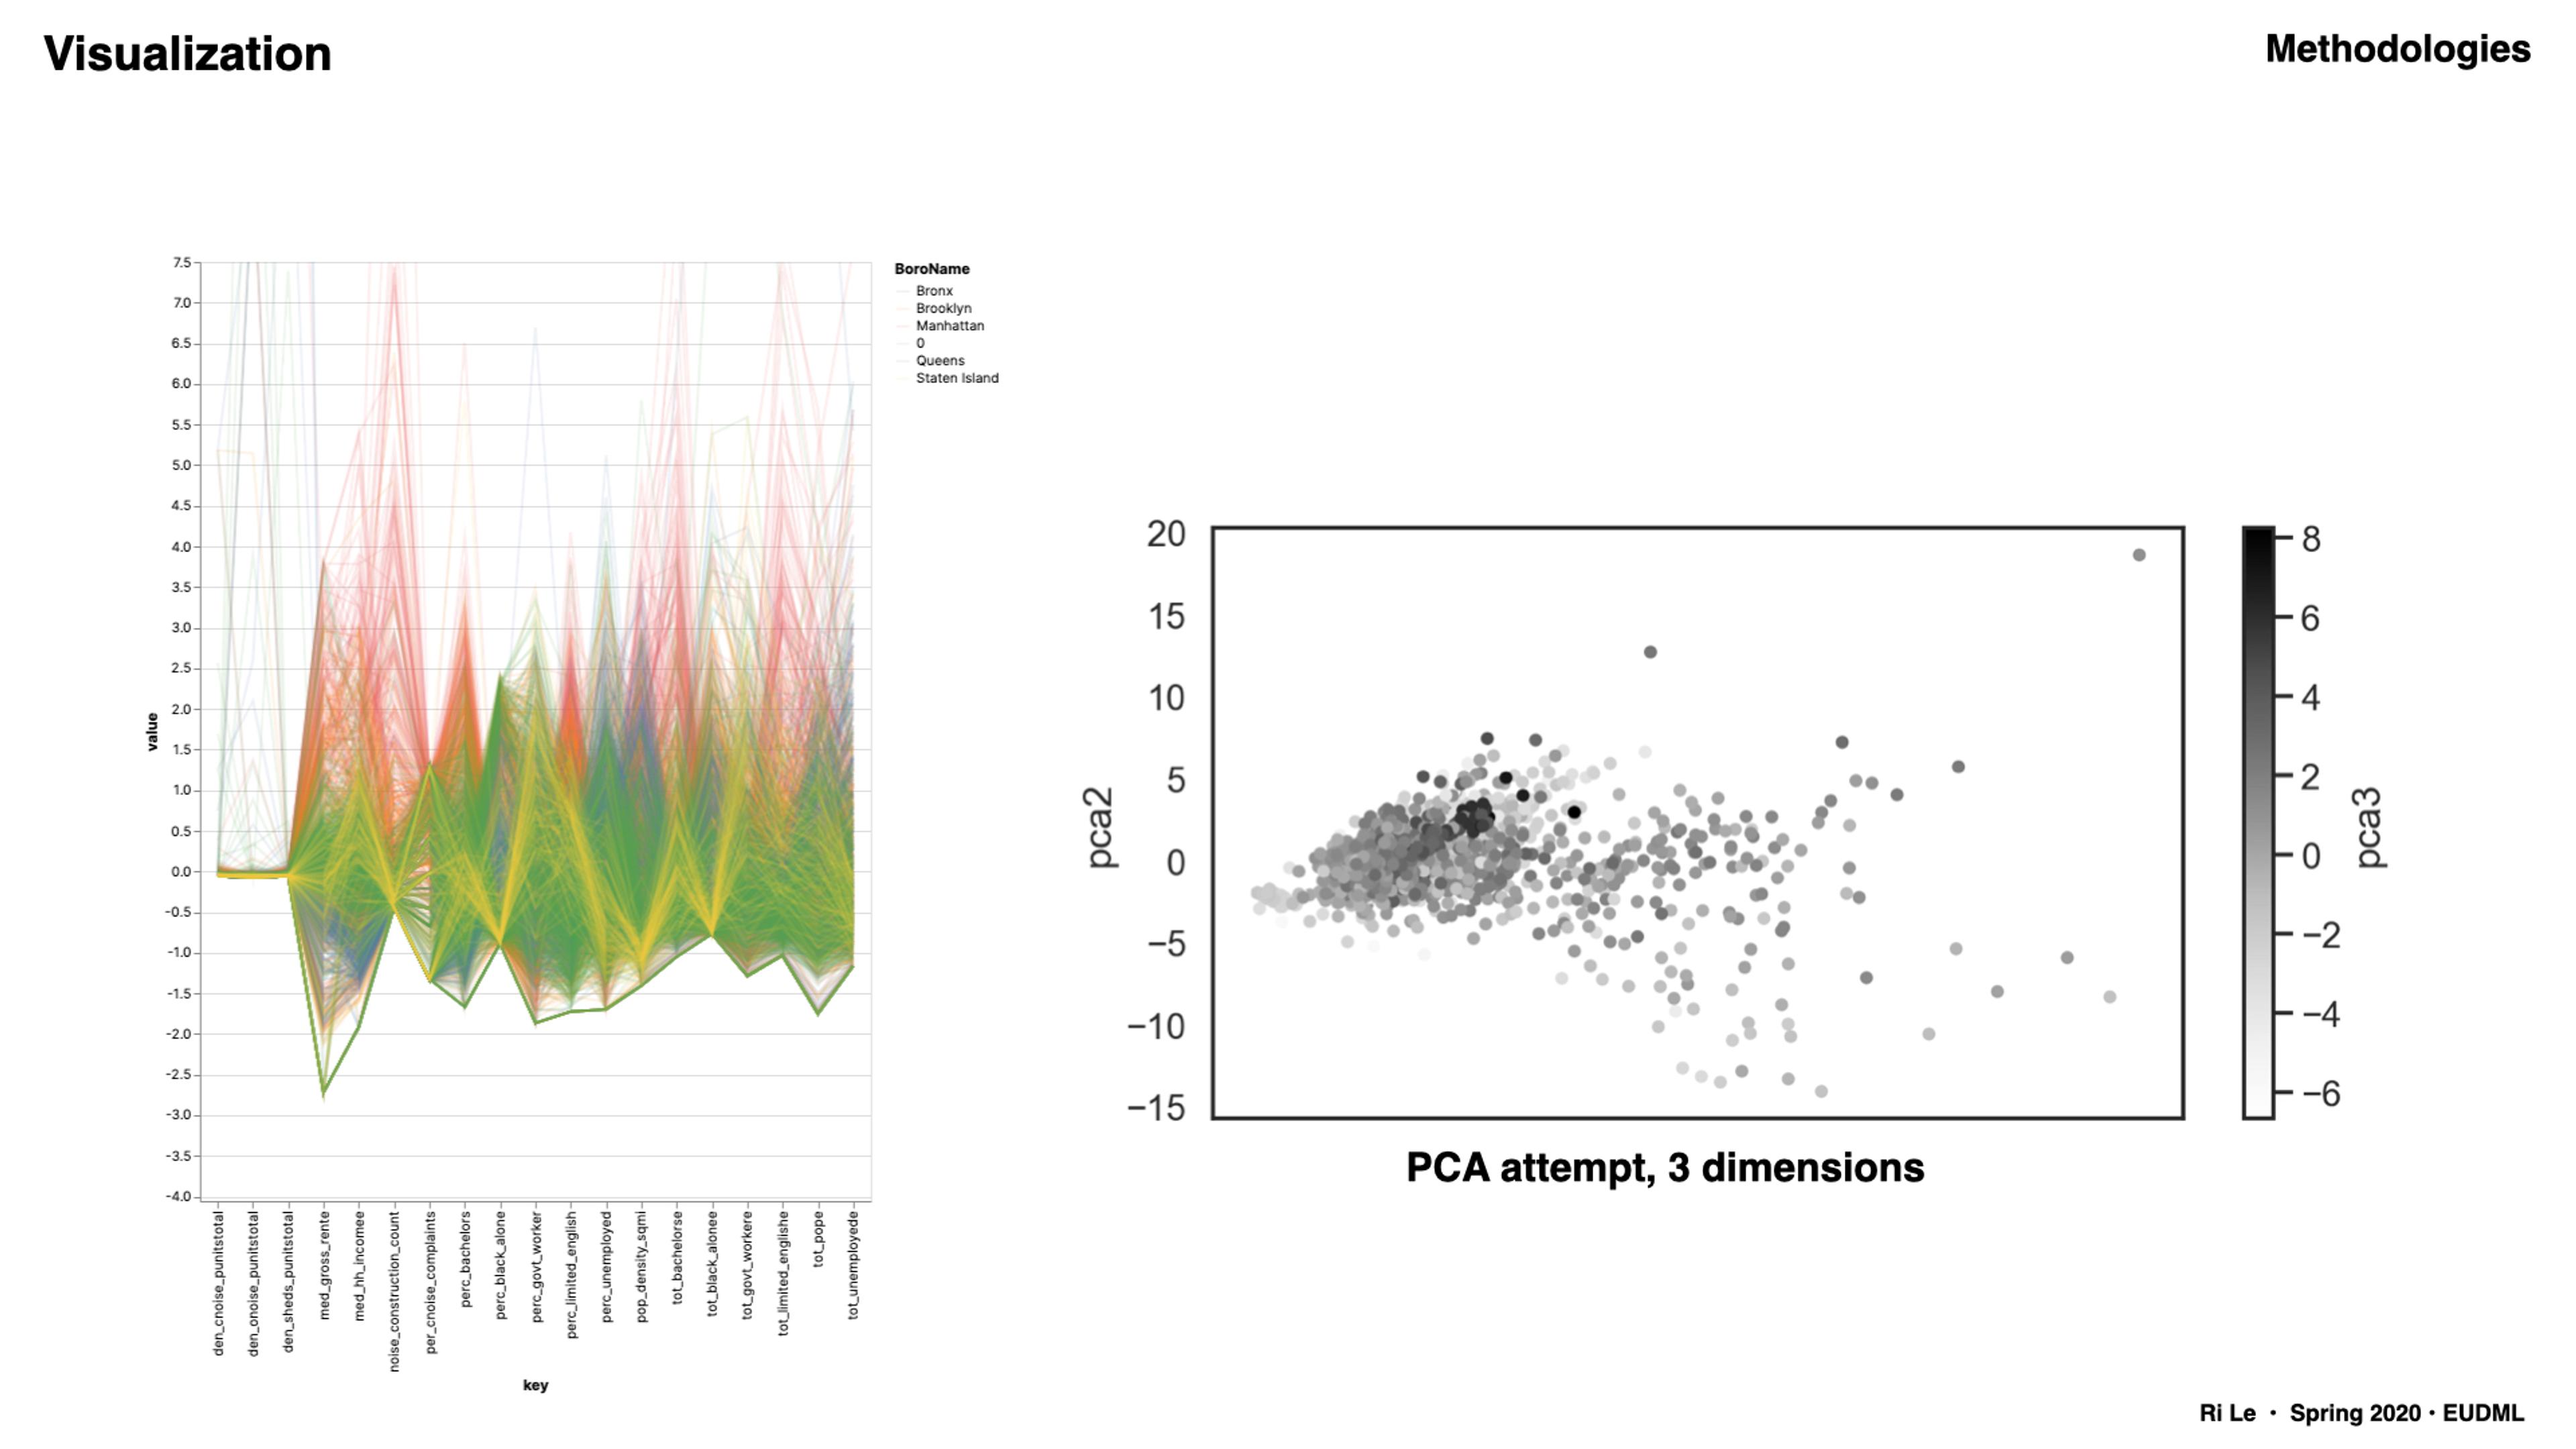
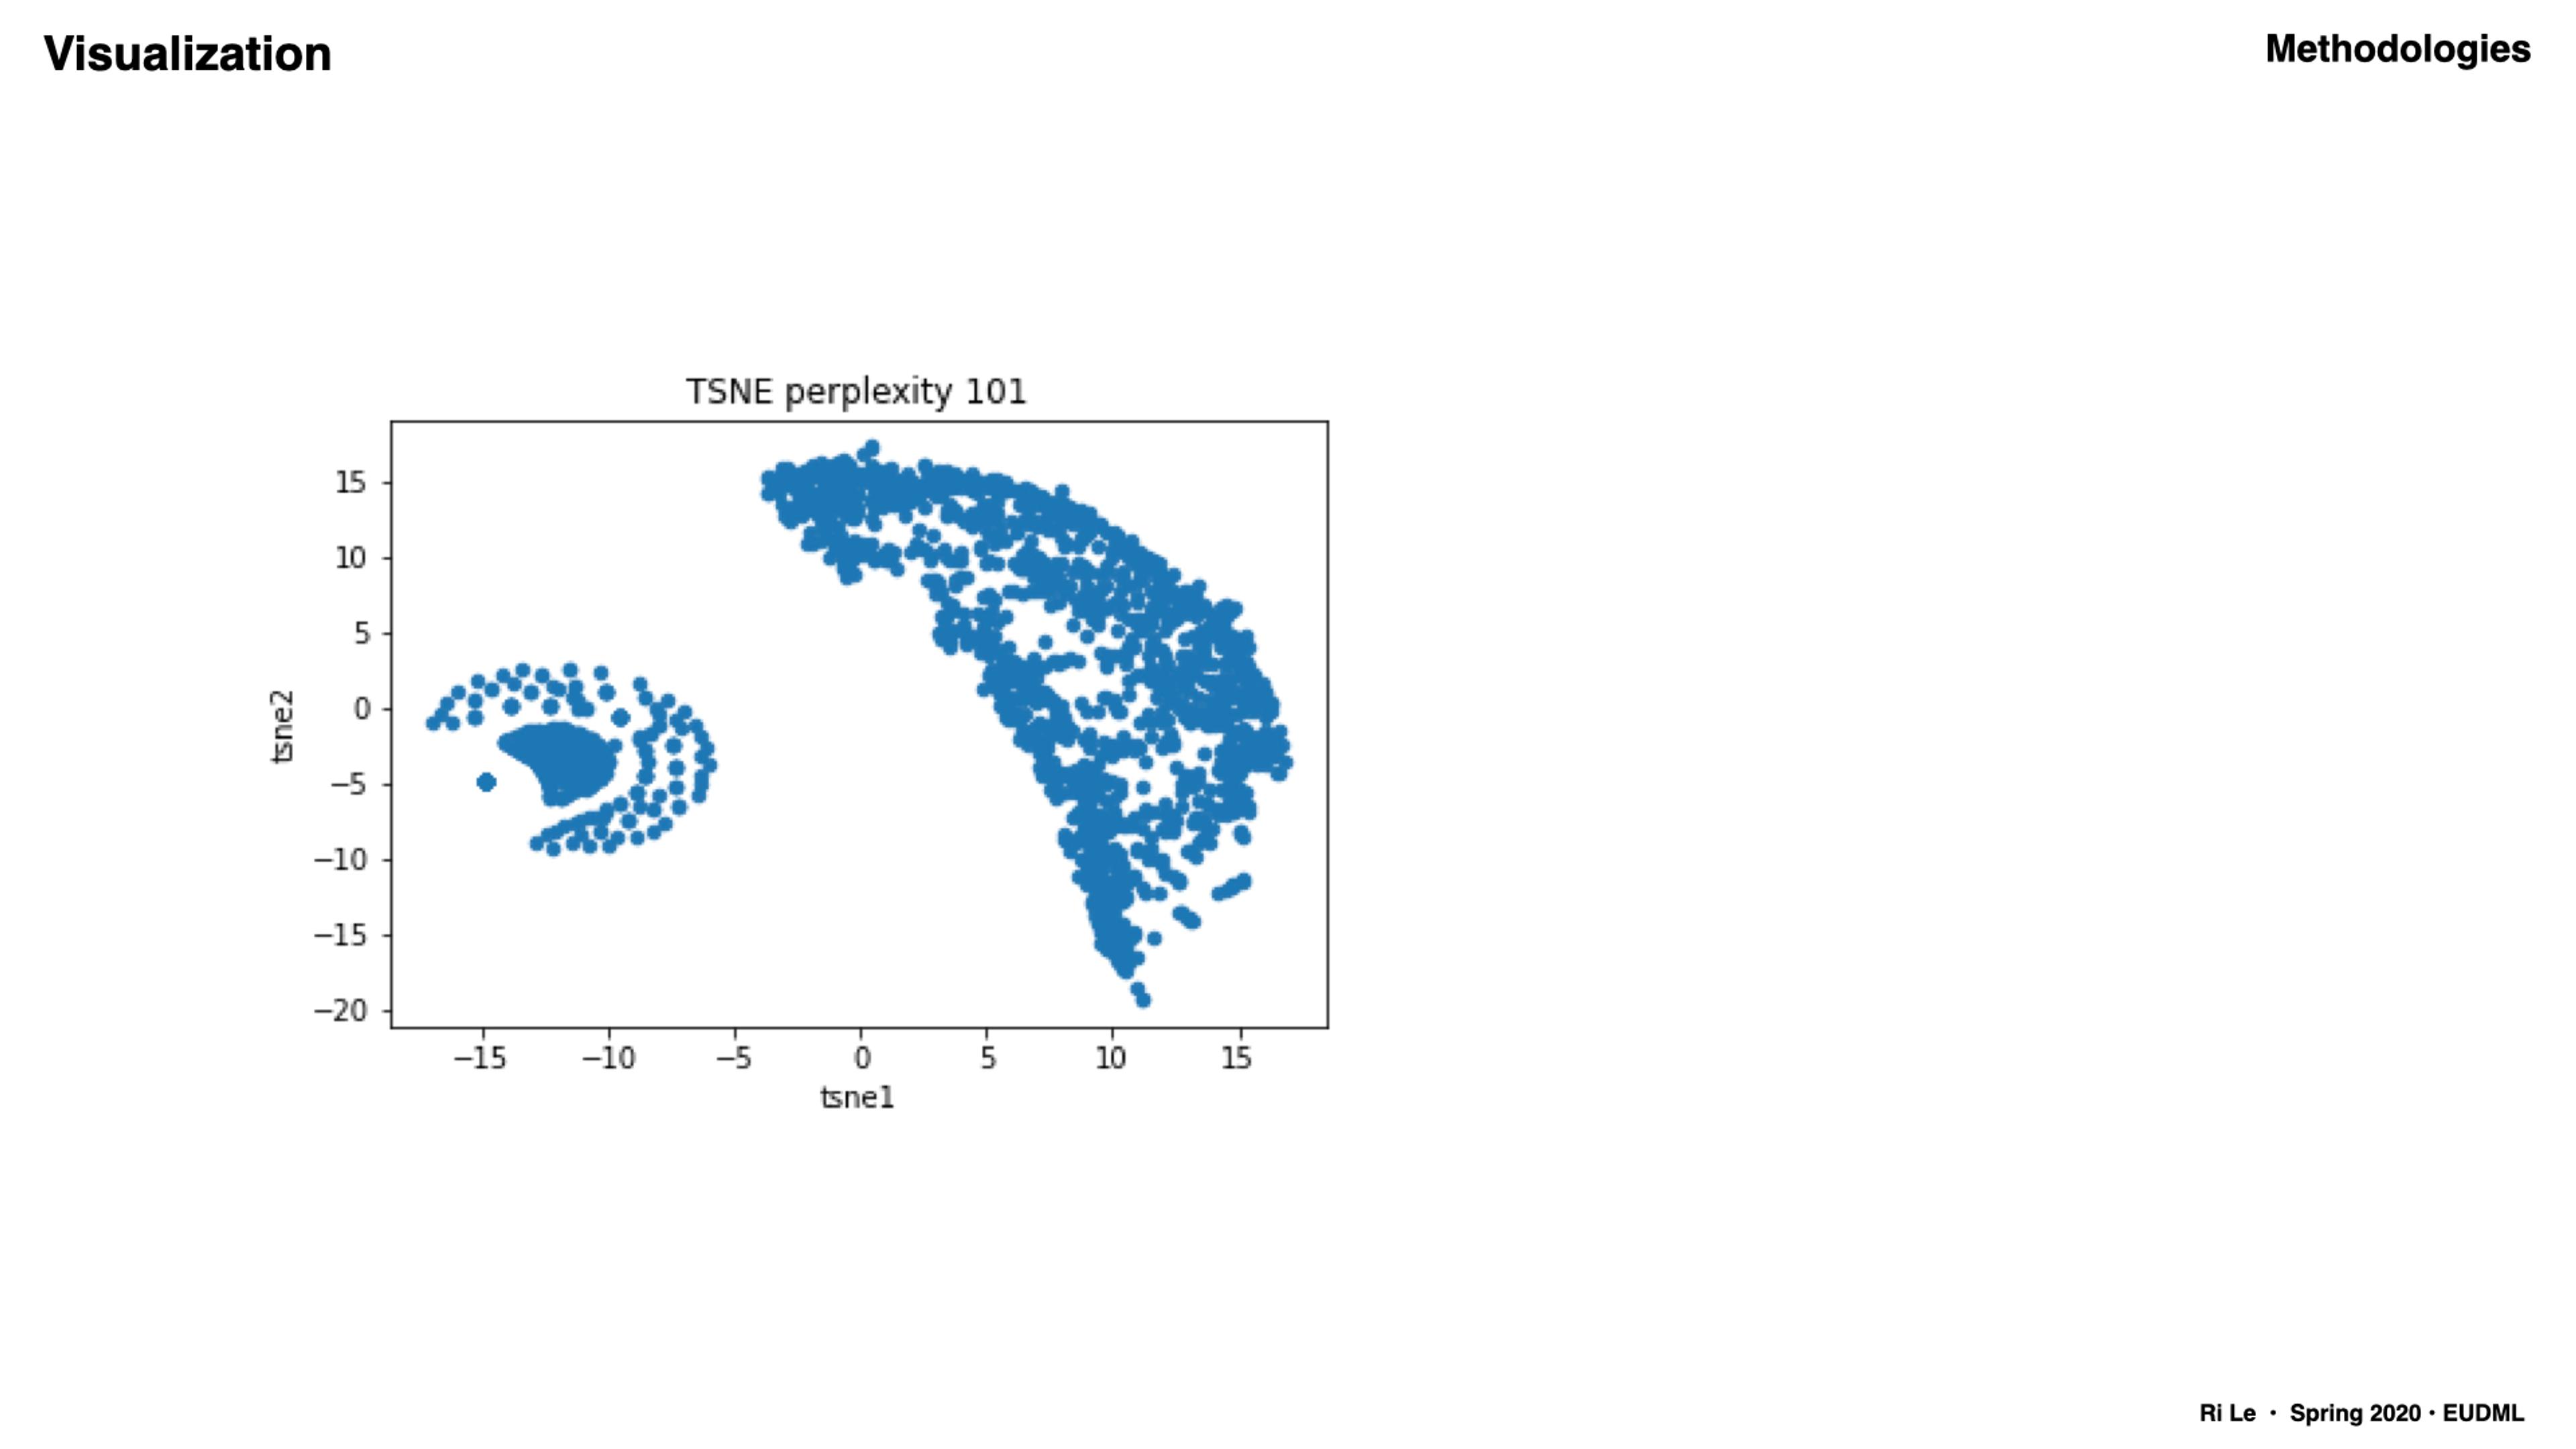
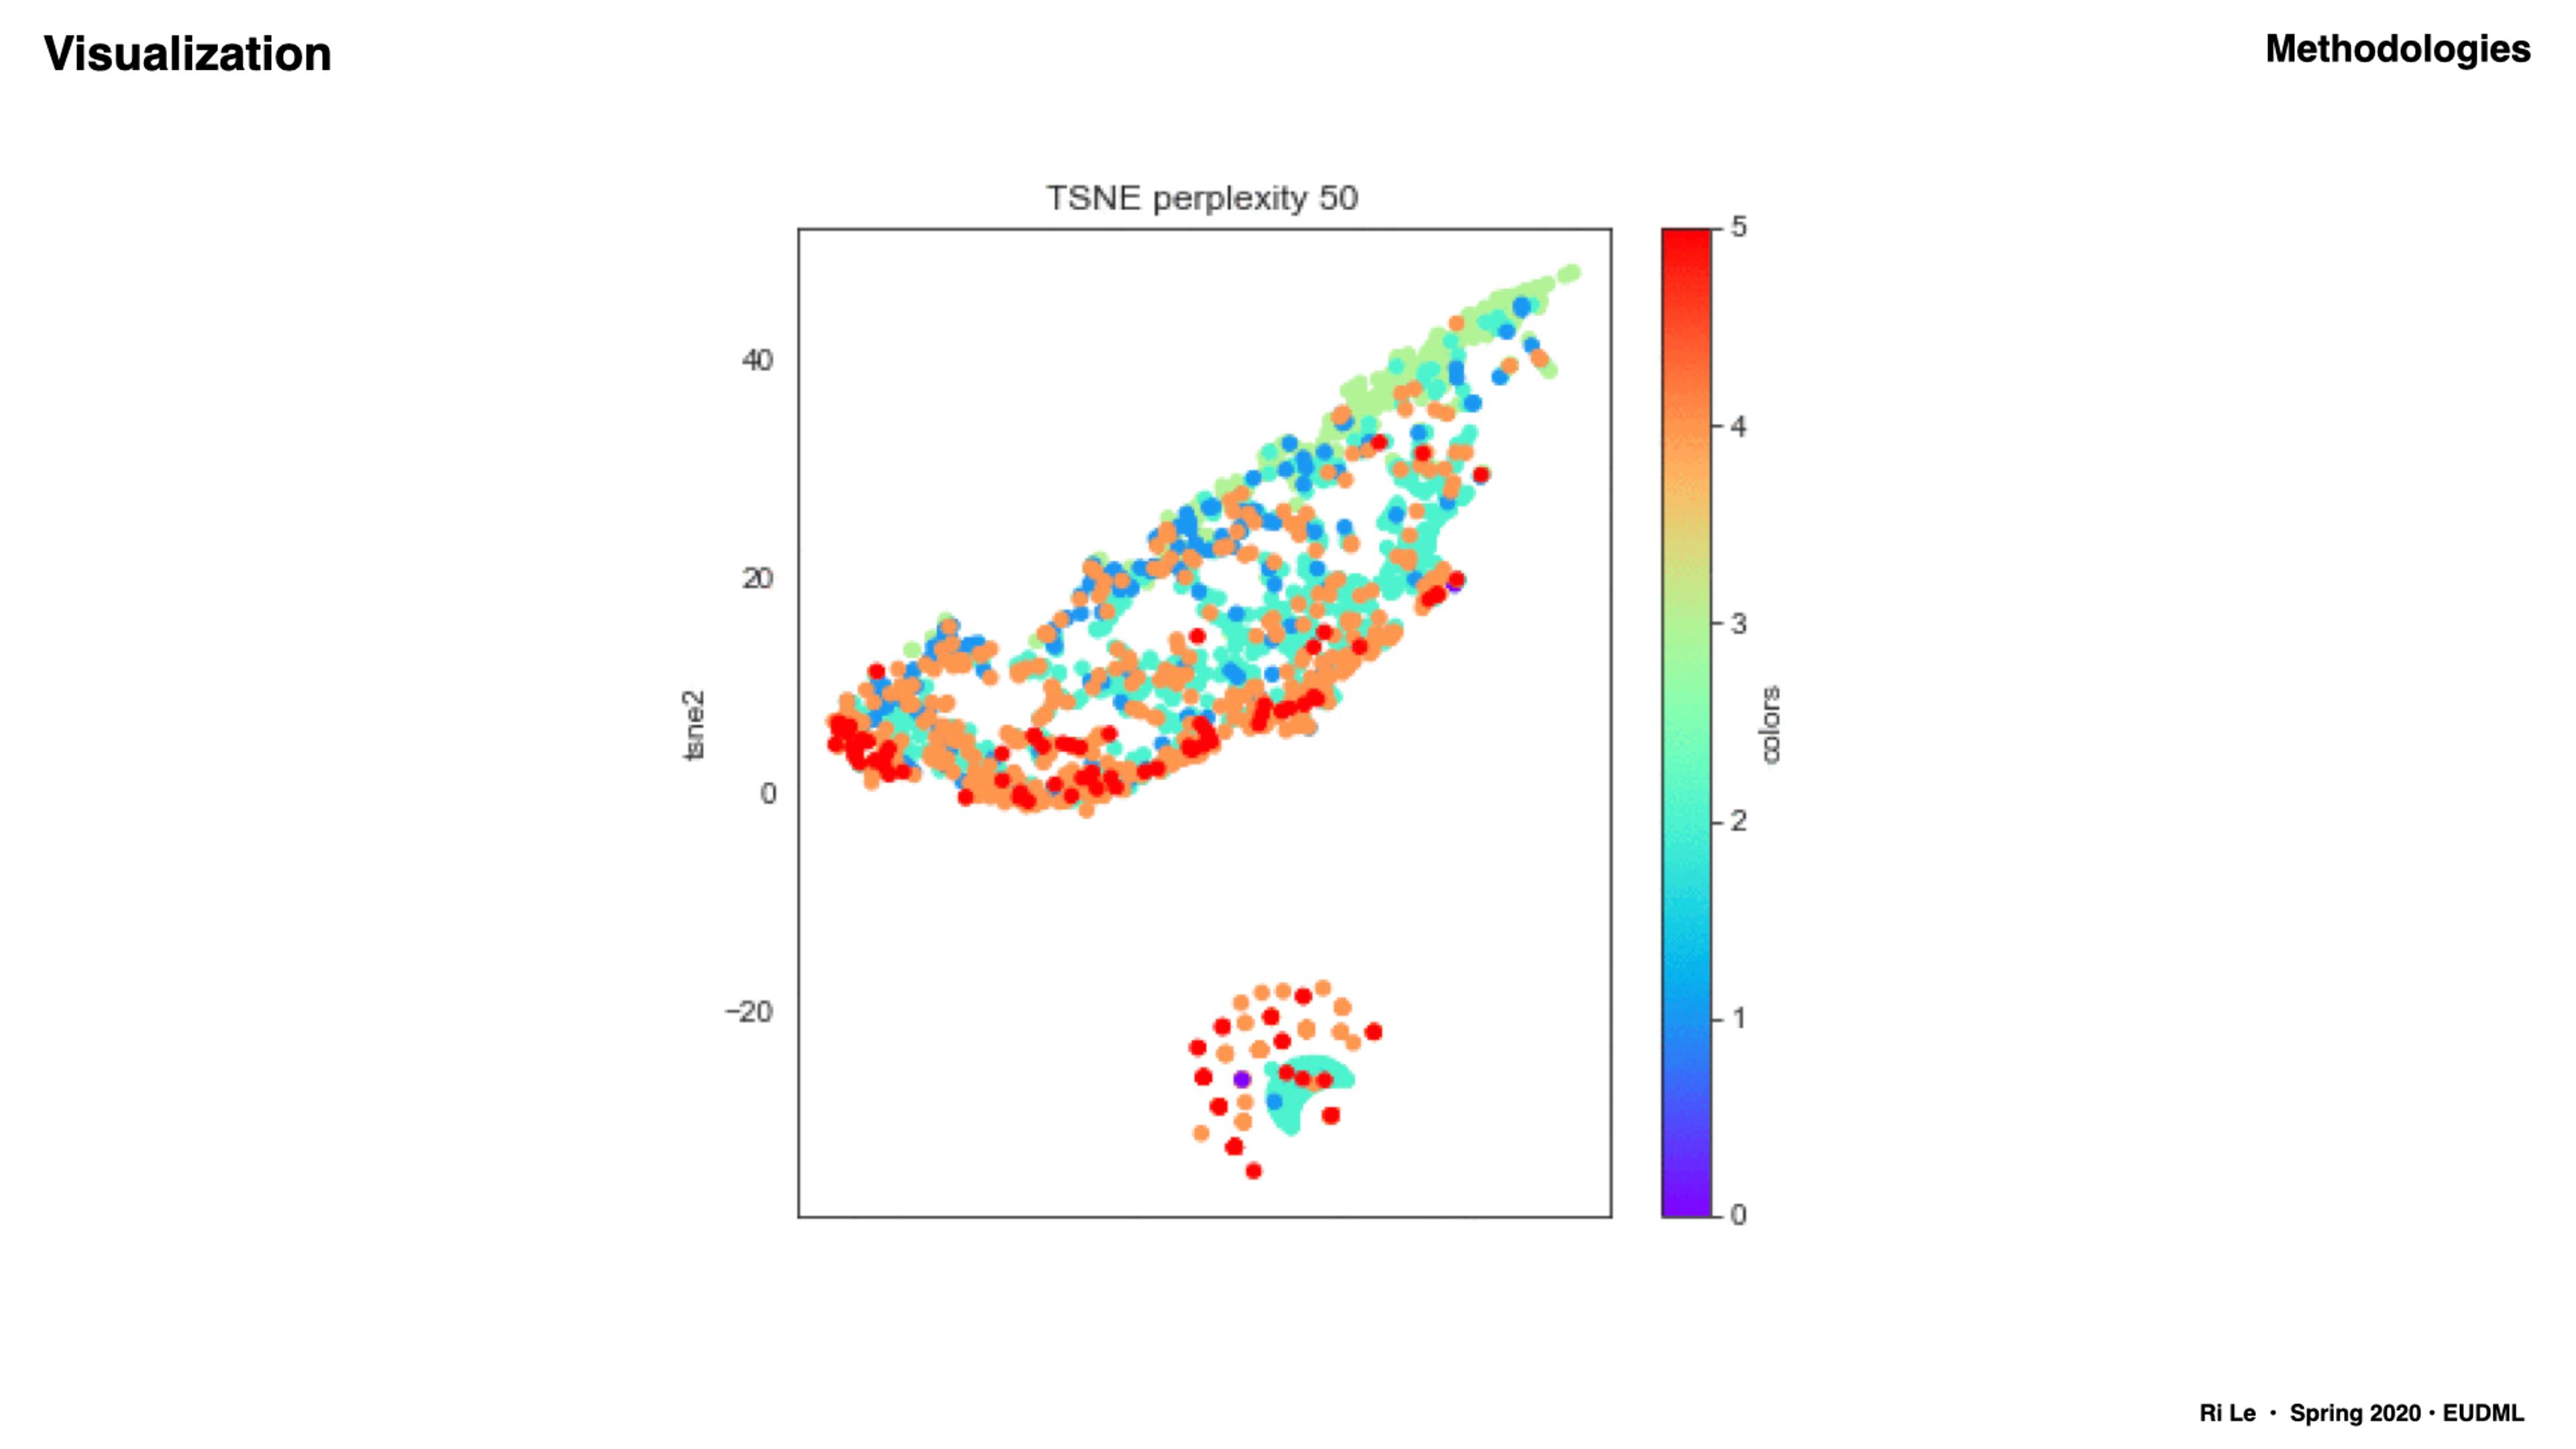
Is it possible to use unsupervised machine learning to discover patterns about construction noise in NYC? I trained a model to predict and describe predictors of construction noise using NYC Open Data, and used visualization and various new regression (XGBoost), clustering (HDBSCAN) and dimensionality reduction techniques (T-SNE) to explore the dataset.
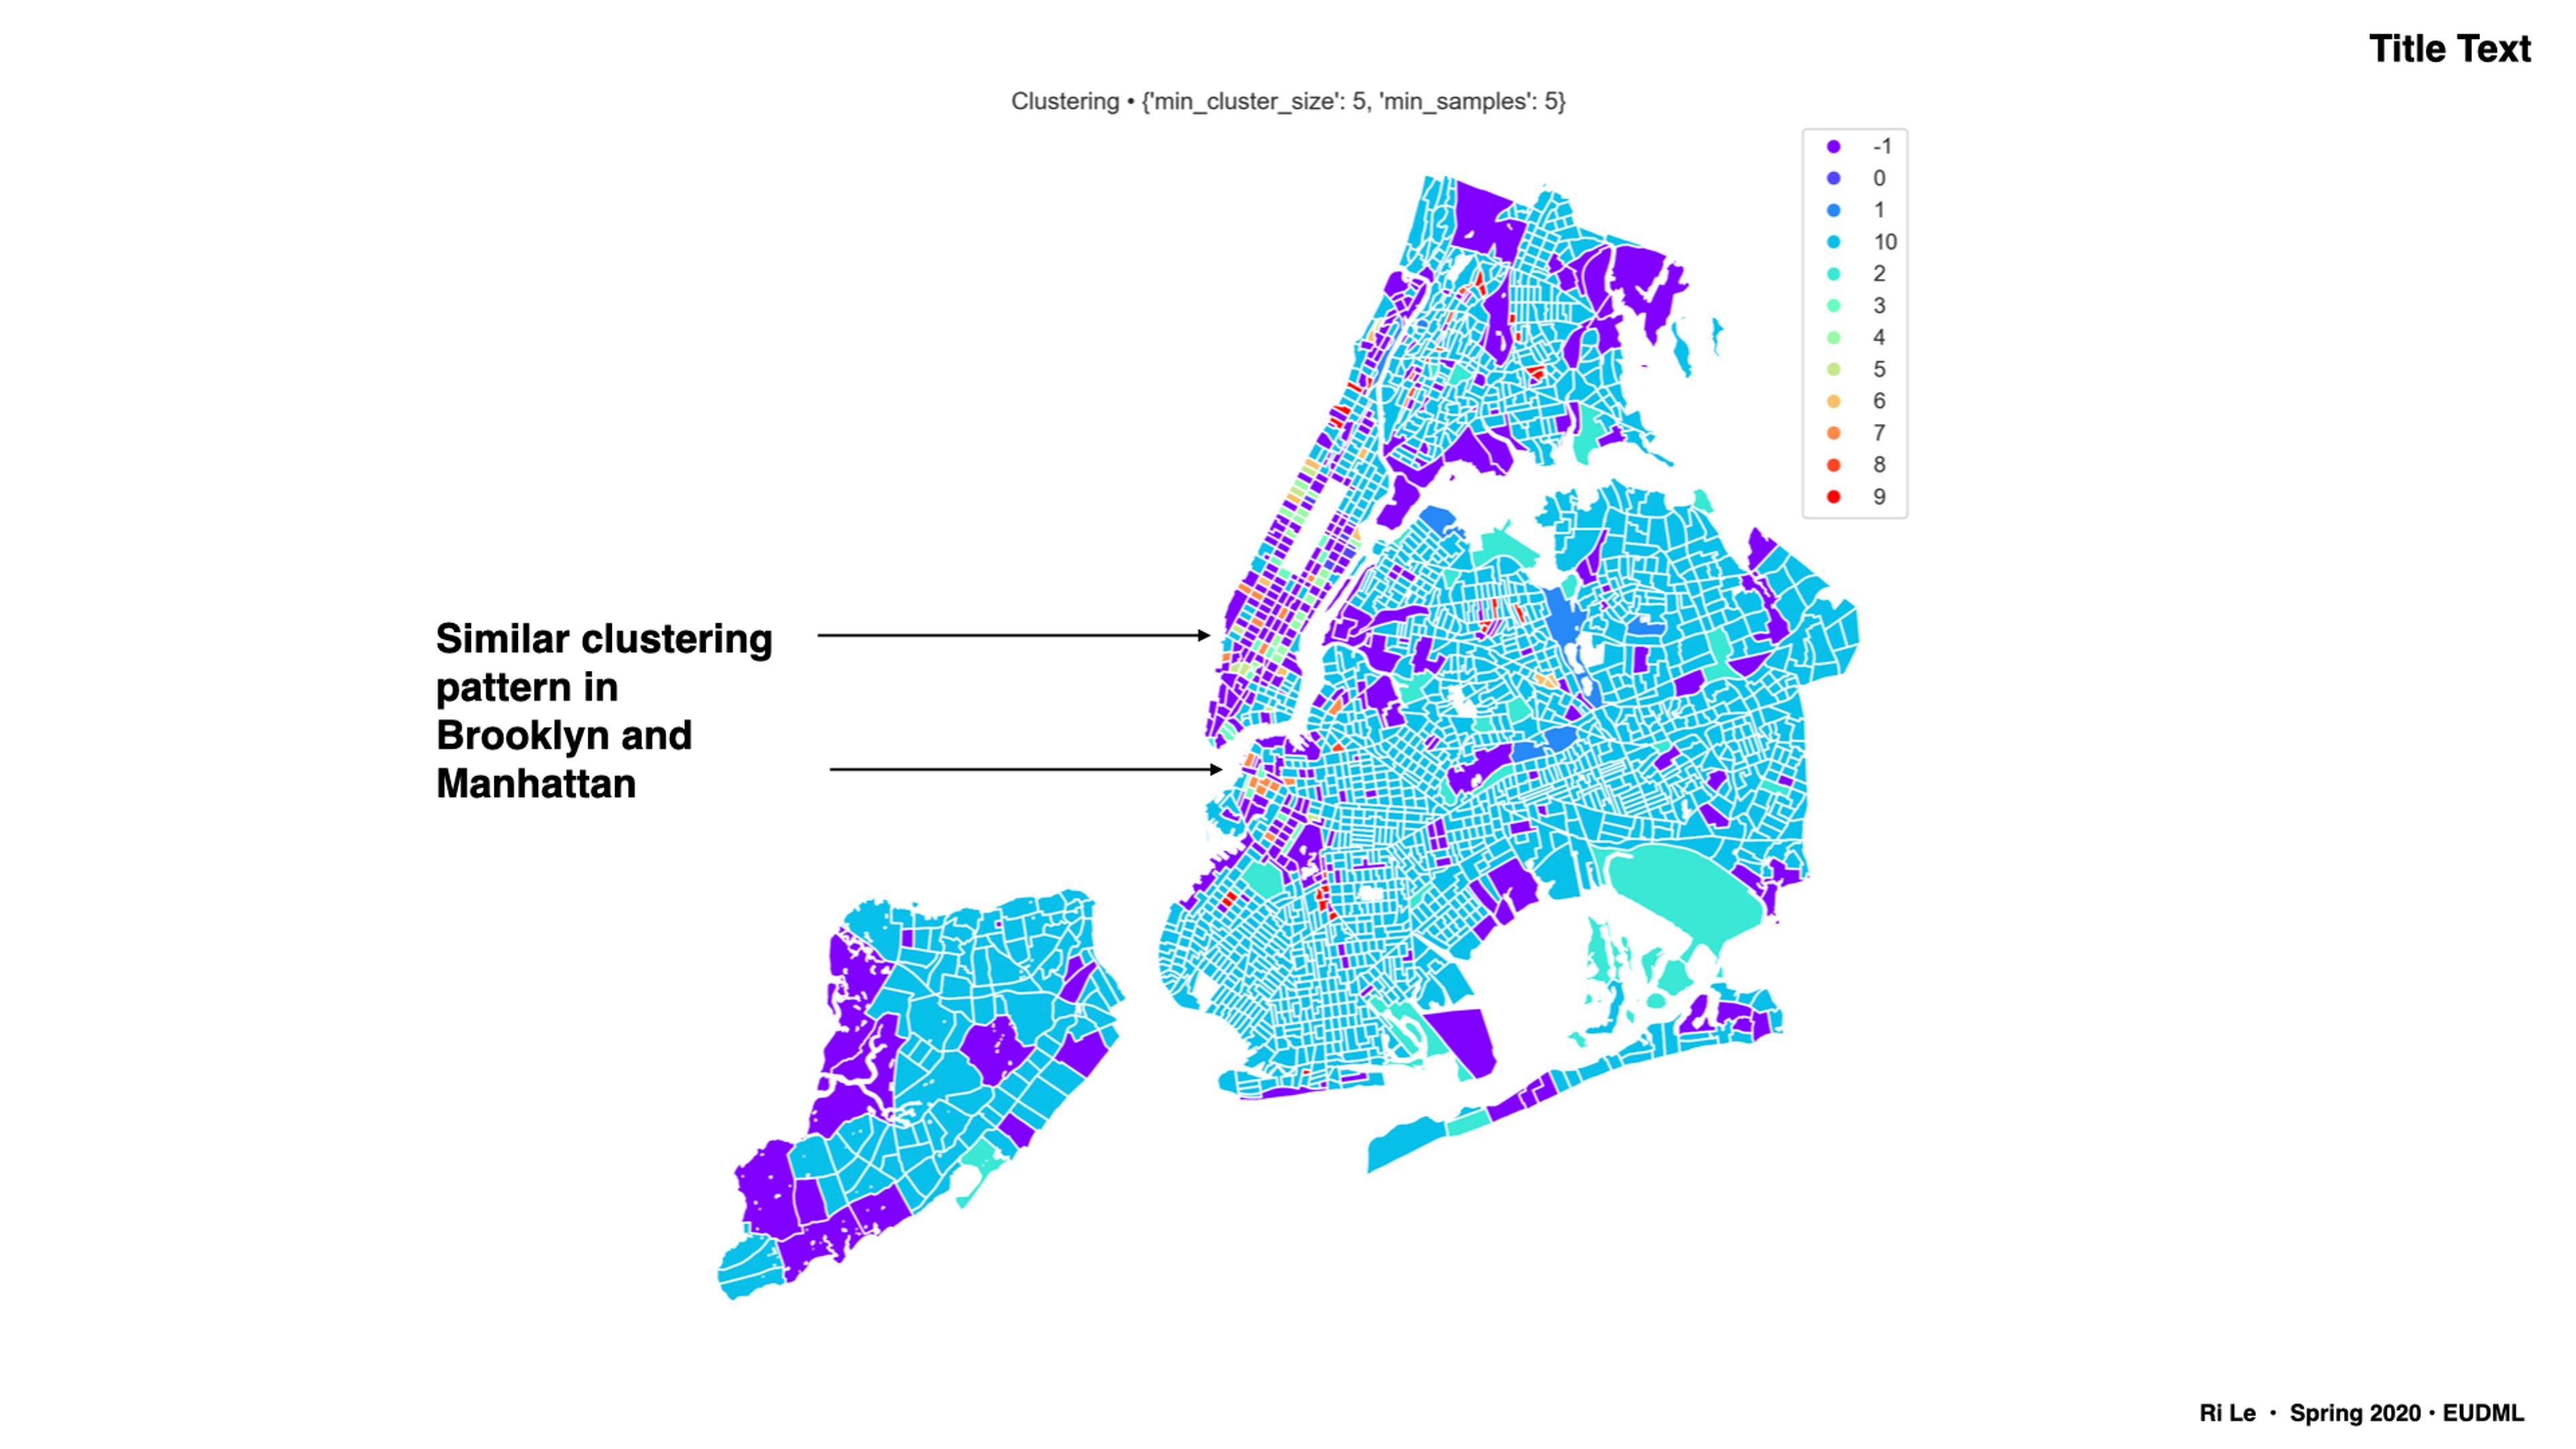
Overall, there is a pattern of noise complaints and construction activity in areas near Brooklyn and Manhattan. This likely corresponds to the popularity of areas such as Williamsburg and Long Island City, which have seen new rapid development in the last decade. All of the clustering techniques used in this project show that there are clusters in Midtown Manhattan and Williamsburg, as well as Long Island City.
This knowledge provides another avenue for planners to potentially forecast and understand economic development in New York City on a local level, without using any data that directly corresponds to financial information or markets. Additionally, there are few measures available for assessing economic development on a local and geographic scale; thus, if a robust method for identifying and verifying economic development could be developed from clustering on other related phenomenon, this could provide stronger predictions for economic development planning.
Final project for Exploring Urban Data with Machine Learning course taught by Boyeong Hong.